Baker Hughes & Sibintek
Background
Baker Hughes, a subsidiary of General Electric, integrates with the GE IoT platform, that empowers industrial operations with advanced analytics capabilities, optimizing workflows and enhancing overall performance management.
Each click on our platform represented a $5K operational decision, so usability wasn’t “nice-to-have.”
Role
Lead designer
Design System
Upon joining the company, I identified inconsistencies across the system's modules, where multiple front-end teams were using various components with overlapping functionalities. This lack of uniformity posed challenges, especially given our tight deadlines for designing and developing numerous scenarios. By implementing a robust Design System, we streamlined our prototyping process and ensured a consistent front-end experience across all modules, resulting in a 30% reduction in design time, a 25% increase in development efficiency.
Analytical Dashboards
Predix Analytical Dashboards are visual tools from GE Digital that help users analyze data to improve asset reliability and performance.
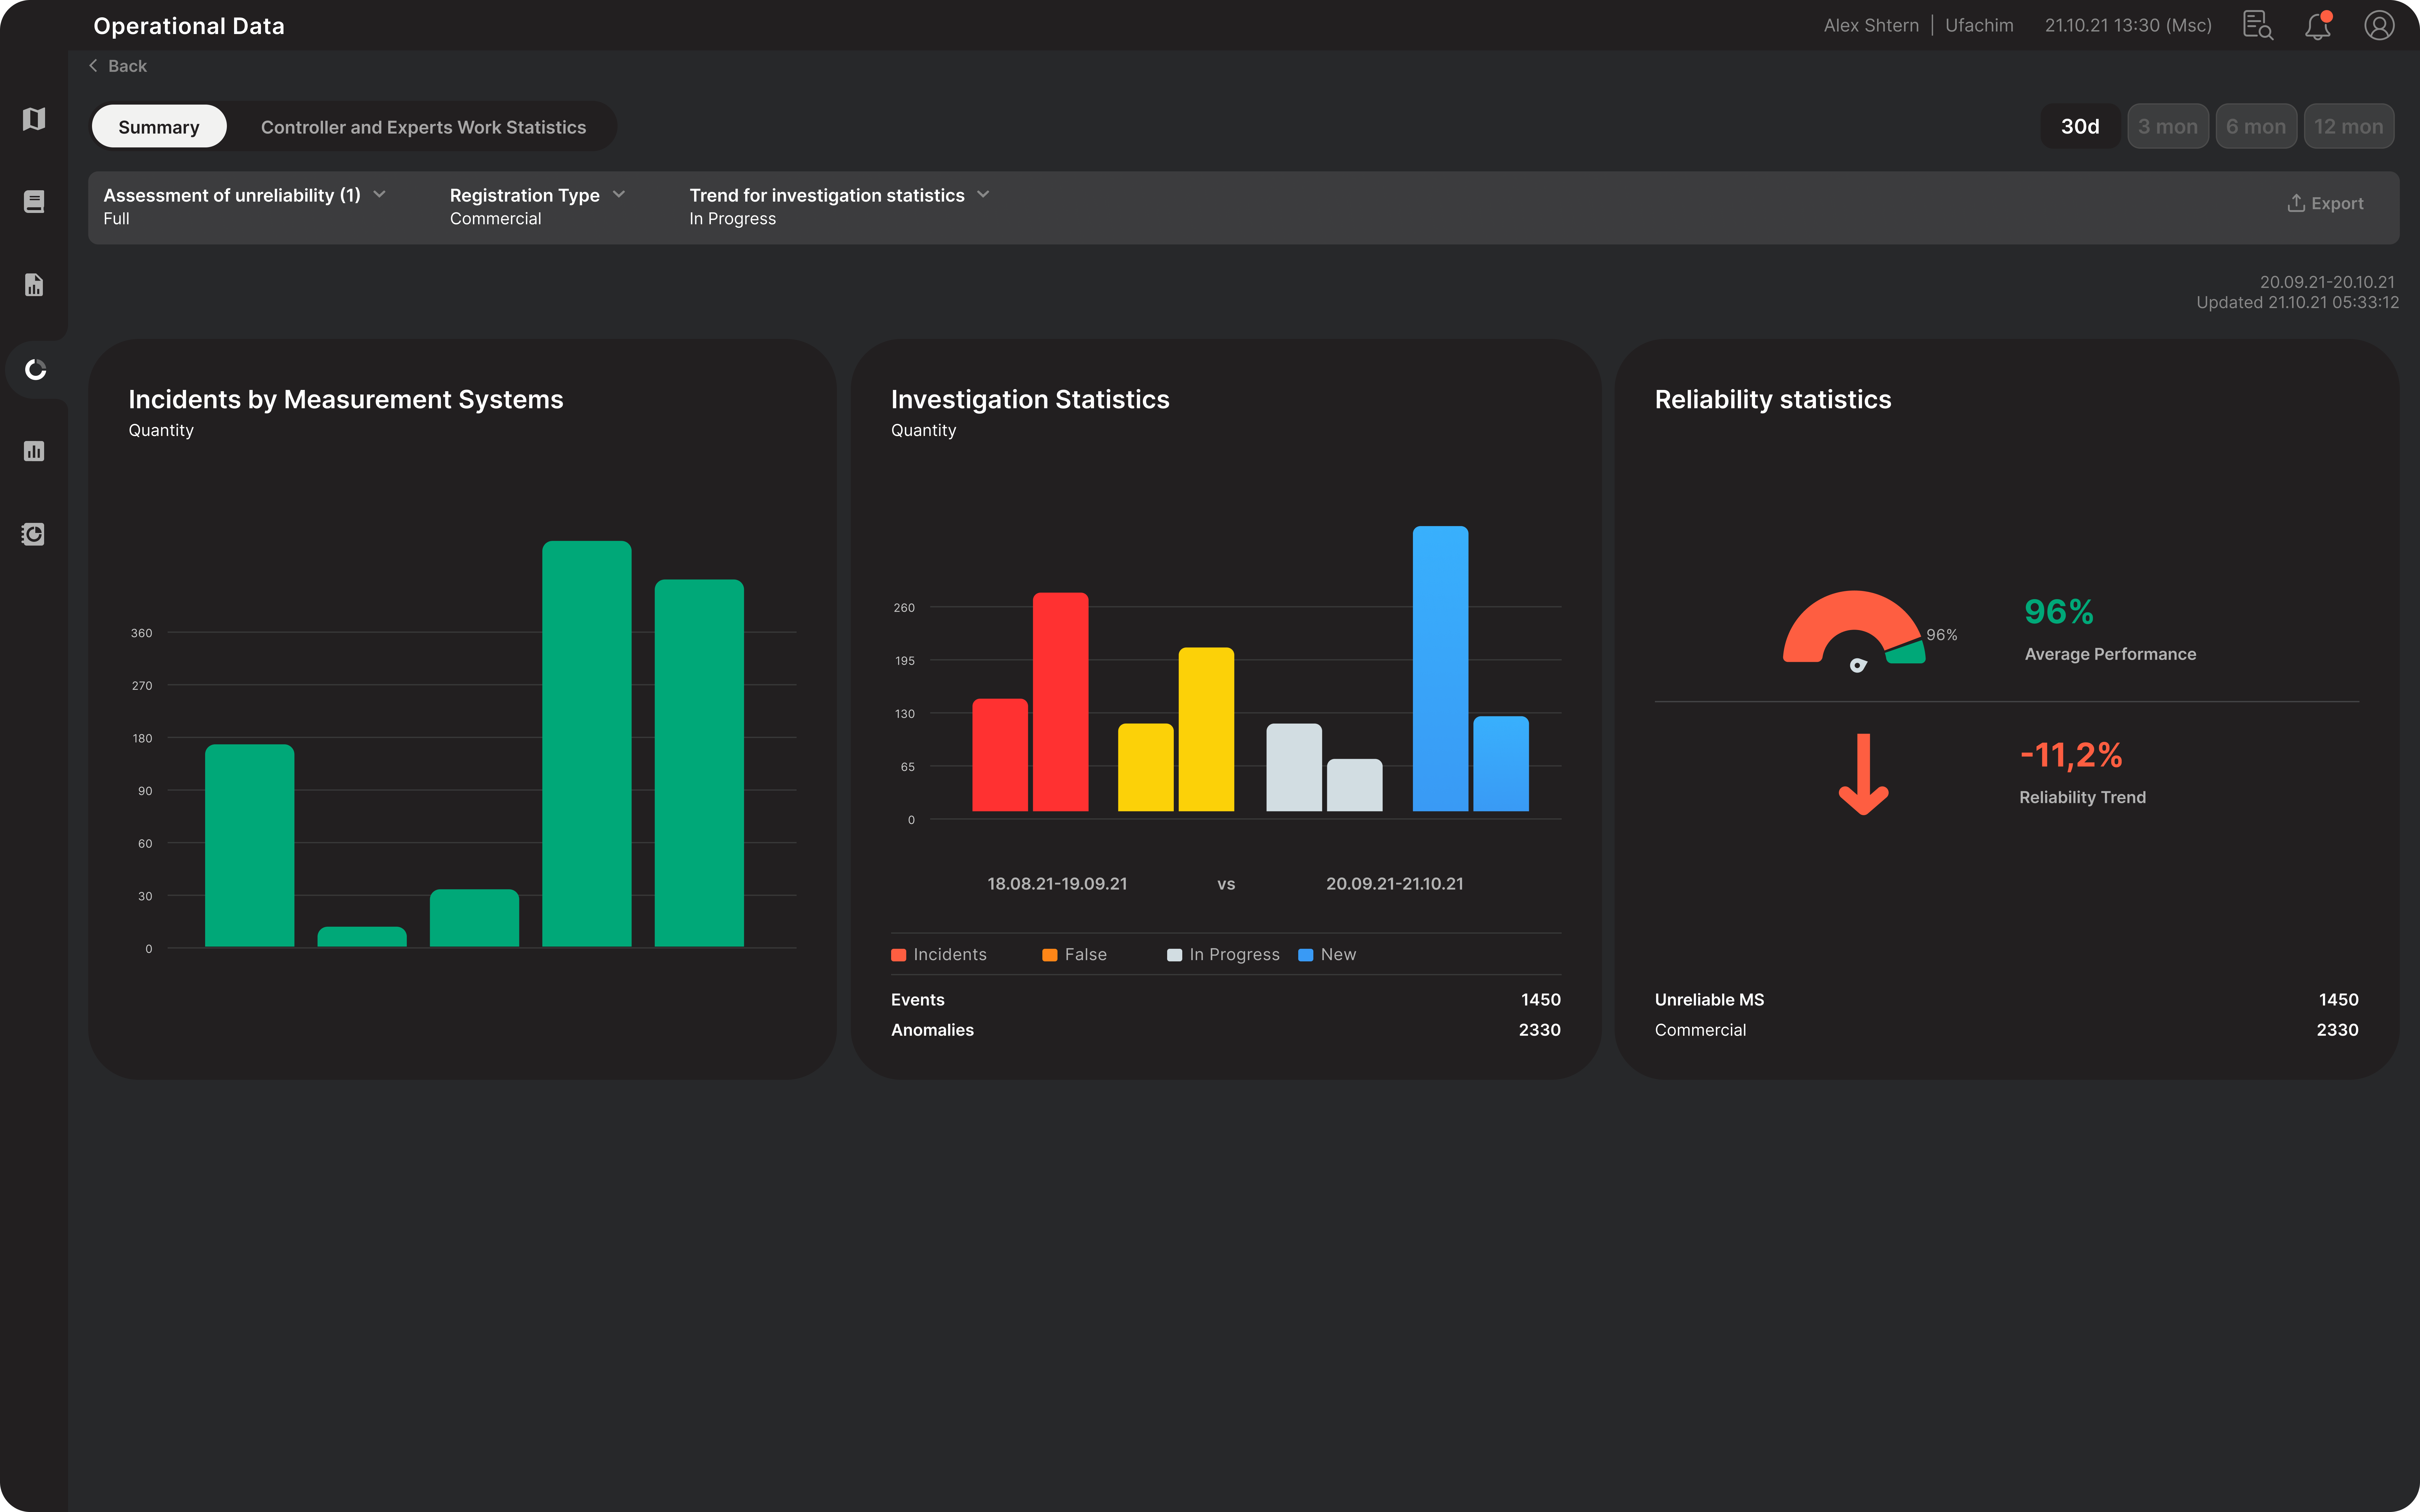
Operational Data Dashboard
Designed an interactive dashboard for Metrologists, providing a comprehensive view of location performance metrics, which resulted in a 30% increase in data accuracy, a 25% reduction in analysis time, and a 40% improvement in decision-making efficiency, thereby significantly enhancing operational performance.
Performance Analytics
Created a data visualization tool for metrologists to monitor and analyze measurement device performance, enabling proactive risk management, resulting in a 30% reduction in device downtime, a 25% improvement in maintenance scheduling efficiency, and a 20% increase in overall measurement accuracy, significantly enhancing operational reliability.


Workflow automation
Beyond data visualization, I designed user flows and interfaces for administrative tasks, alerting systems, incident management and reporting, streamlining workflows for efficient application use.
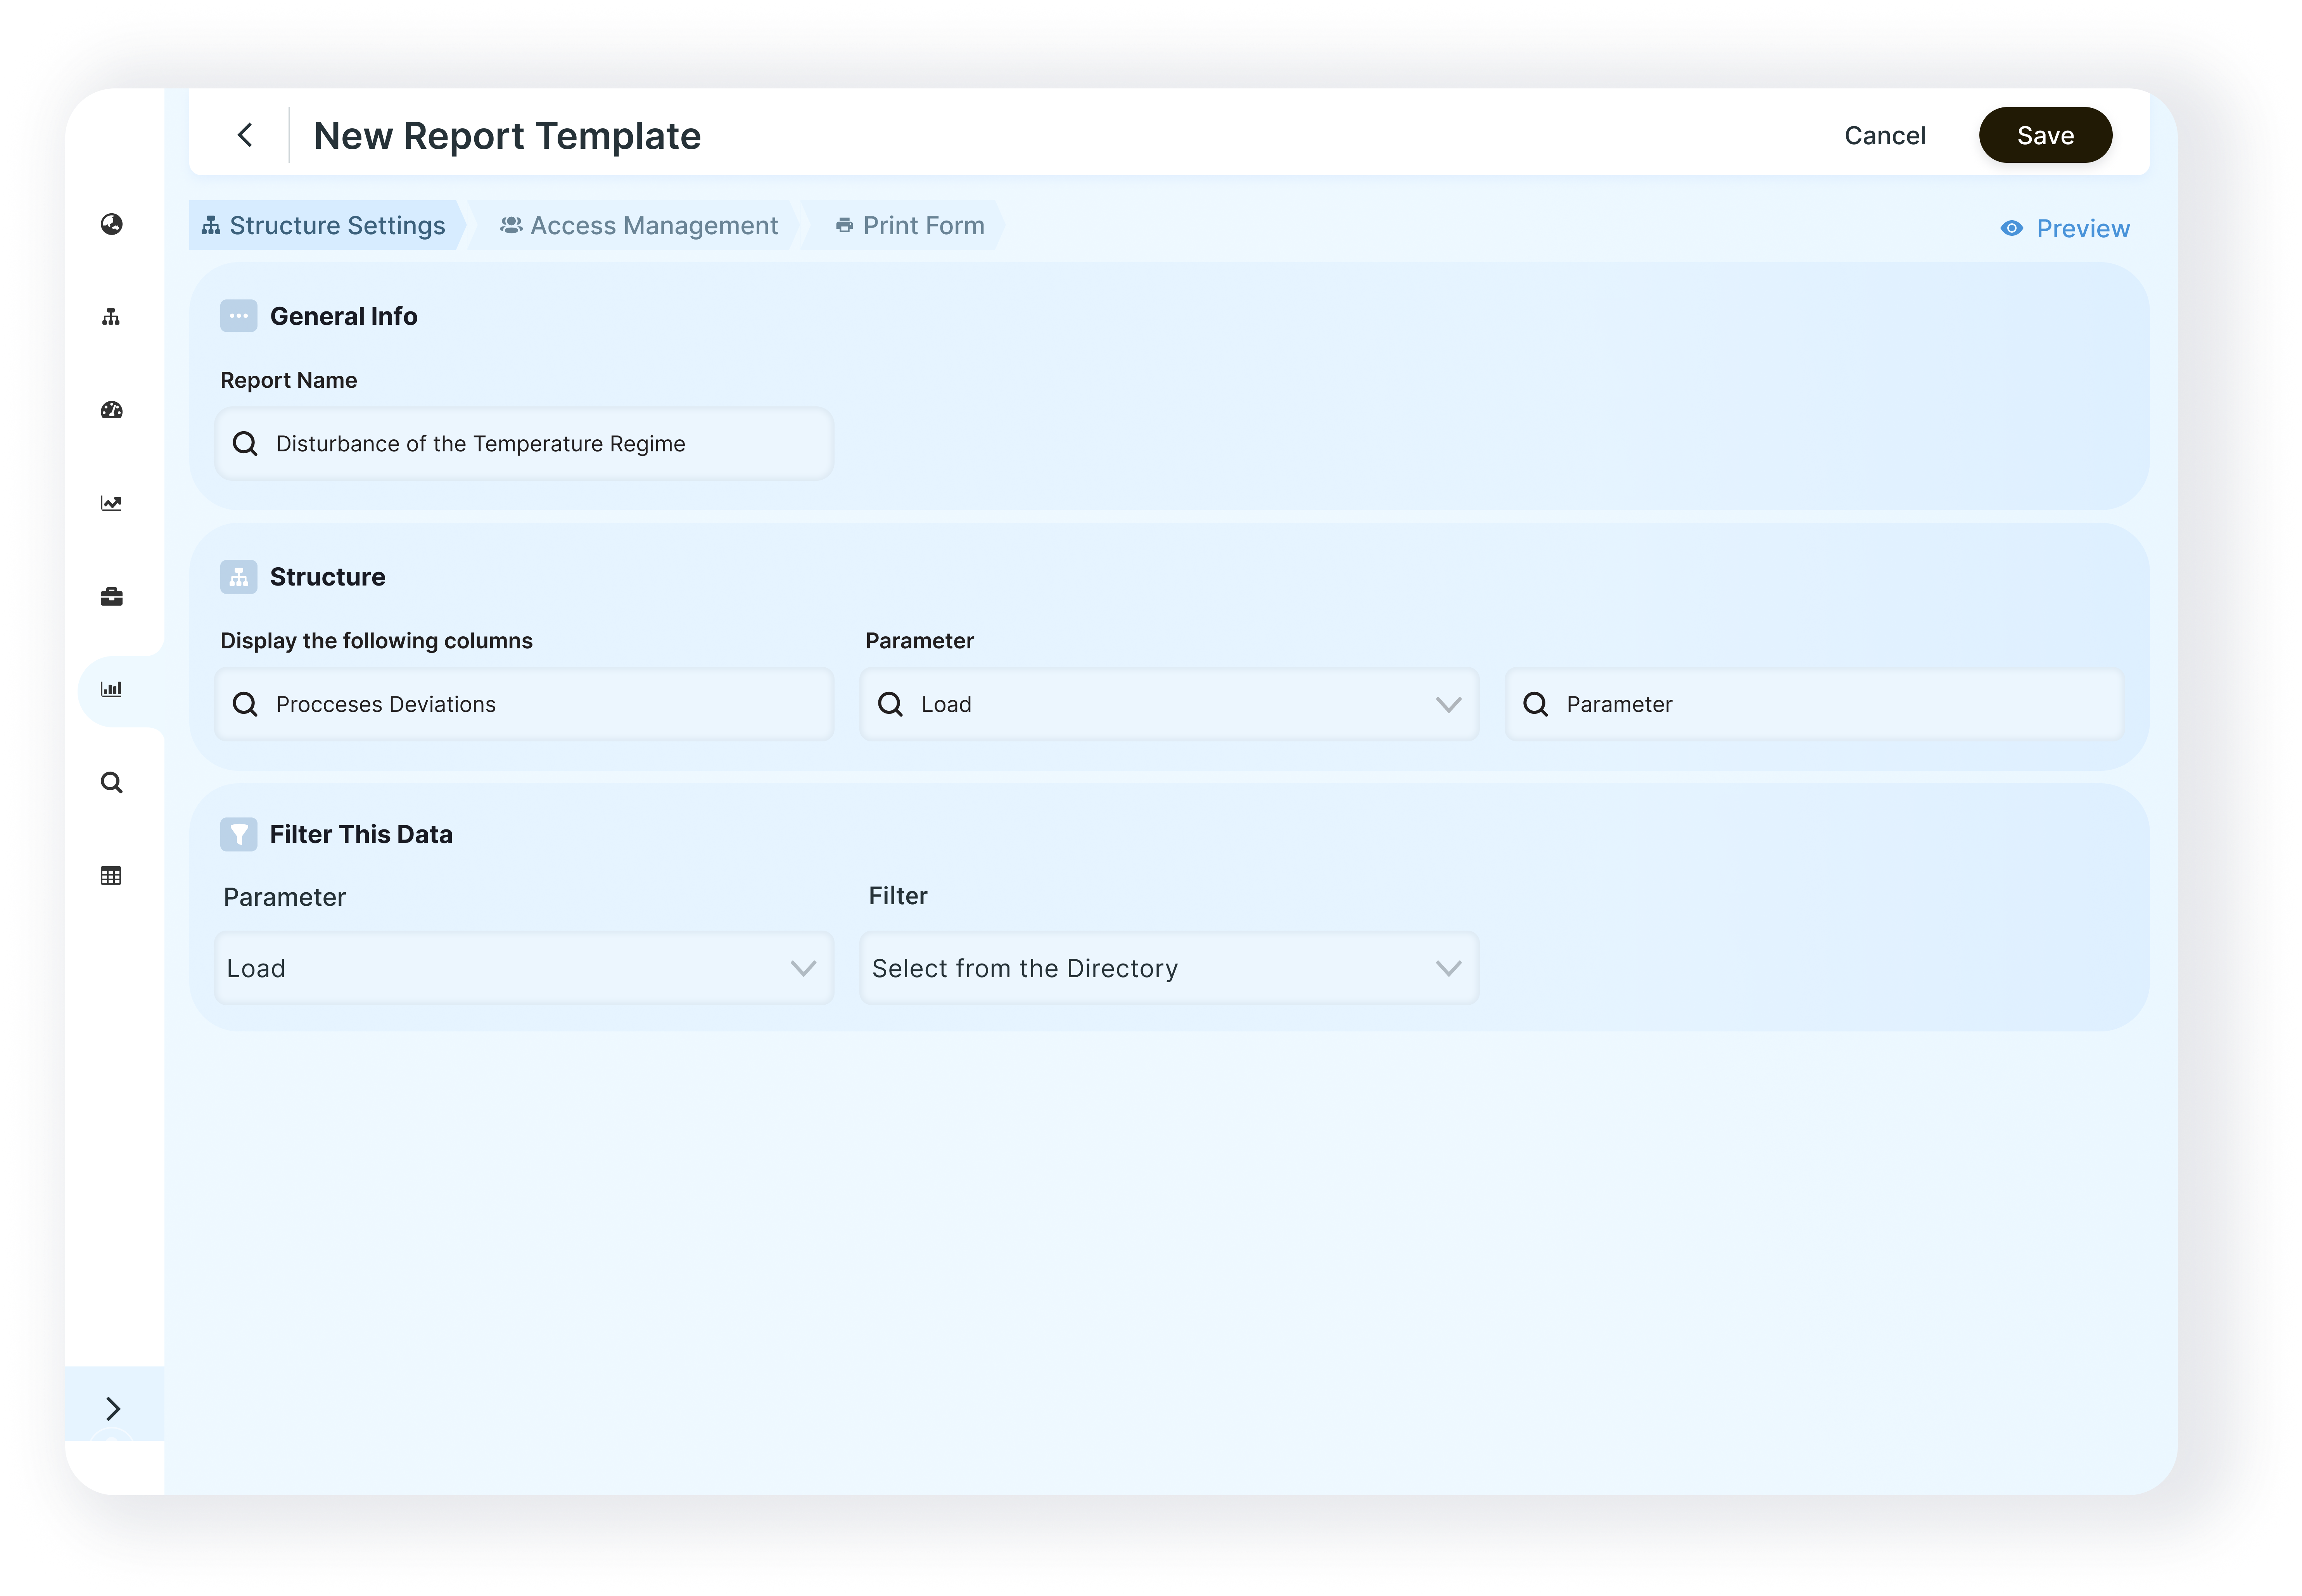
Reports
Custom Reports Generation interface for admin-users, streamlining the report creation process, which empowered end-users to generate tailored reports efficiently, resulting in a 42% reduction in report creation time and a 87% increase in user satisfaction, thereby enhancing overall operational productivity

Incident Reporting
Designed and implemented complex flow for a machine health automation platform from scratch, integrating workflow automation and predictive analytics, resulting in a 35% reduction in task completion time, a 45% improvement in incident resolution time, and a 30% increase in predictive maintenance accuracy, thereby significantly enhancing operational efficiency.

